Results
Based on the real-time sample data that we collected from Salt & Smoke, we found that once the restaurant filled up, a group of 3 was given an estimated wait time of 10-15 minutes. The actual wait time in this scenario turned out to be 4 minutes. Comparing this information to the results gathered from our simulation and the implemented method, we established the success of our experiment.
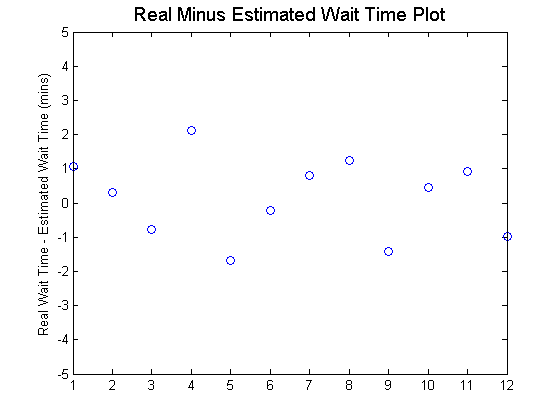
With our simulated data, our goal was to analyze the difference between the real wait times and estimated wait times of any party that was placed in the waitlist for any period of time. For a given simulated evening, approximately 80-90 parties would enter the restaurant. Out of these parties, about 10-12 parties are waitlisted at some point in their experience. Calculating and plotting the difference between these parties’ real and estimated wait times shows us that, under normal dining parameters, our estimates are accurate. The plot below shows these calculated differences from one particular simulation. In this plot, we see that the differences don’t exceed approximately ±2 mins.
With our simulated data, our goal was to analyze the difference between the real wait times and estimated wait times of any party that was placed in the waitlist for any period of time. For a given simulated evening, approximately 80-90 parties would enter the restaurant. Out of these parties, about 10-12 parties are waitlisted at some point in their experience. Calculating and plotting the difference between these parties’ real and estimated wait times shows us that, under normal dining parameters, our estimates are accurate. The plot below shows these calculated differences from one particular simulation. In this plot, we see that the differences don’t exceed approximately ±2 mins.