Estimation Method
The method used to compute wait time estimates for parties entering the wait list was designed to complement any Point of Service (POS) system. This method obtains menu, table, entering party, server, and wait list information from the POS system to estimate the wait time of a new, incoming party. To explain how this value is estimated, we envision a scenario in which a family of 4 comes into a restaurant. Assuming that the restaurant is packed but no wait list exists, our method will find the table of 4 that is closest to finishing their meal and leaving the restaurant. This is done through the use of the dishes’ cook times and the statistical data on how long customers stay at the restaurant after the arrival of their food. For our estimation method, we initially do so using data we collected from Salt & Smoke. However, part way through the simulation, we can choose to shift to calculating the wait time using past data stored by our system. The family of 4’s wait time will hence be equal to the time in which the next table of 4 becomes available.
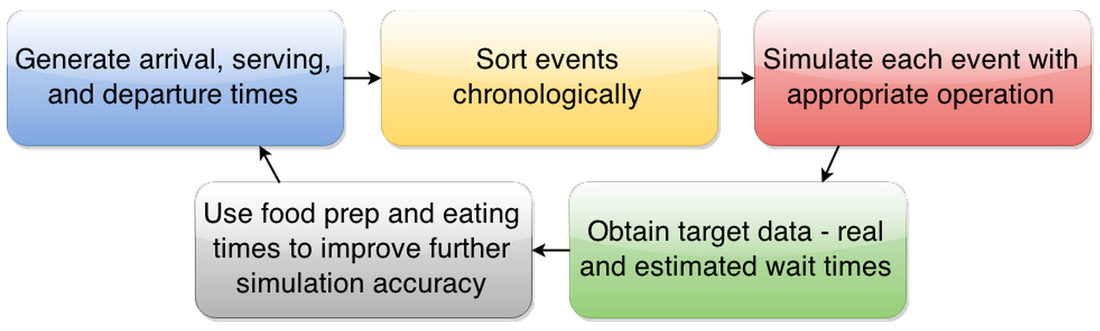
In order to merge our simulation and estimation model, we developed a simulation model that used the events randomly generated by our simulation and ran the functions representing the appropriate simulation event in chronological order. At the end of one simulated evening, data regarding the accuracy of our wait time estimates is reported and the cooking time and eating time data is fed back into the next simulation to improve the accuracy of the next run’s estimates. This process is shown in the flowchart below.
In order to merge our simulation and estimation model, we developed a simulation model that used the events randomly generated by our simulation and ran the functions representing the appropriate simulation event in chronological order. At the end of one simulated evening, data regarding the accuracy of our wait time estimates is reported and the cooking time and eating time data is fed back into the next simulation to improve the accuracy of the next run’s estimates. This process is shown in the flowchart below.